




Your Meta dashboard says the ads more than paid for themselves. Shopify says something different. Add Google and your email platform and between them they claim more revenue than your shop took all month.
ROAS means return on ad spend: revenue divided by what you spent to get it. It sounds like a simple sum. It isn't, because the platform reporting the revenue half wants you to keep spending.
Most teams respond by hunting for the mistake, and after a week they turn up two or three small things worth fixing. They fix them, and the gap sits exactly where it was.
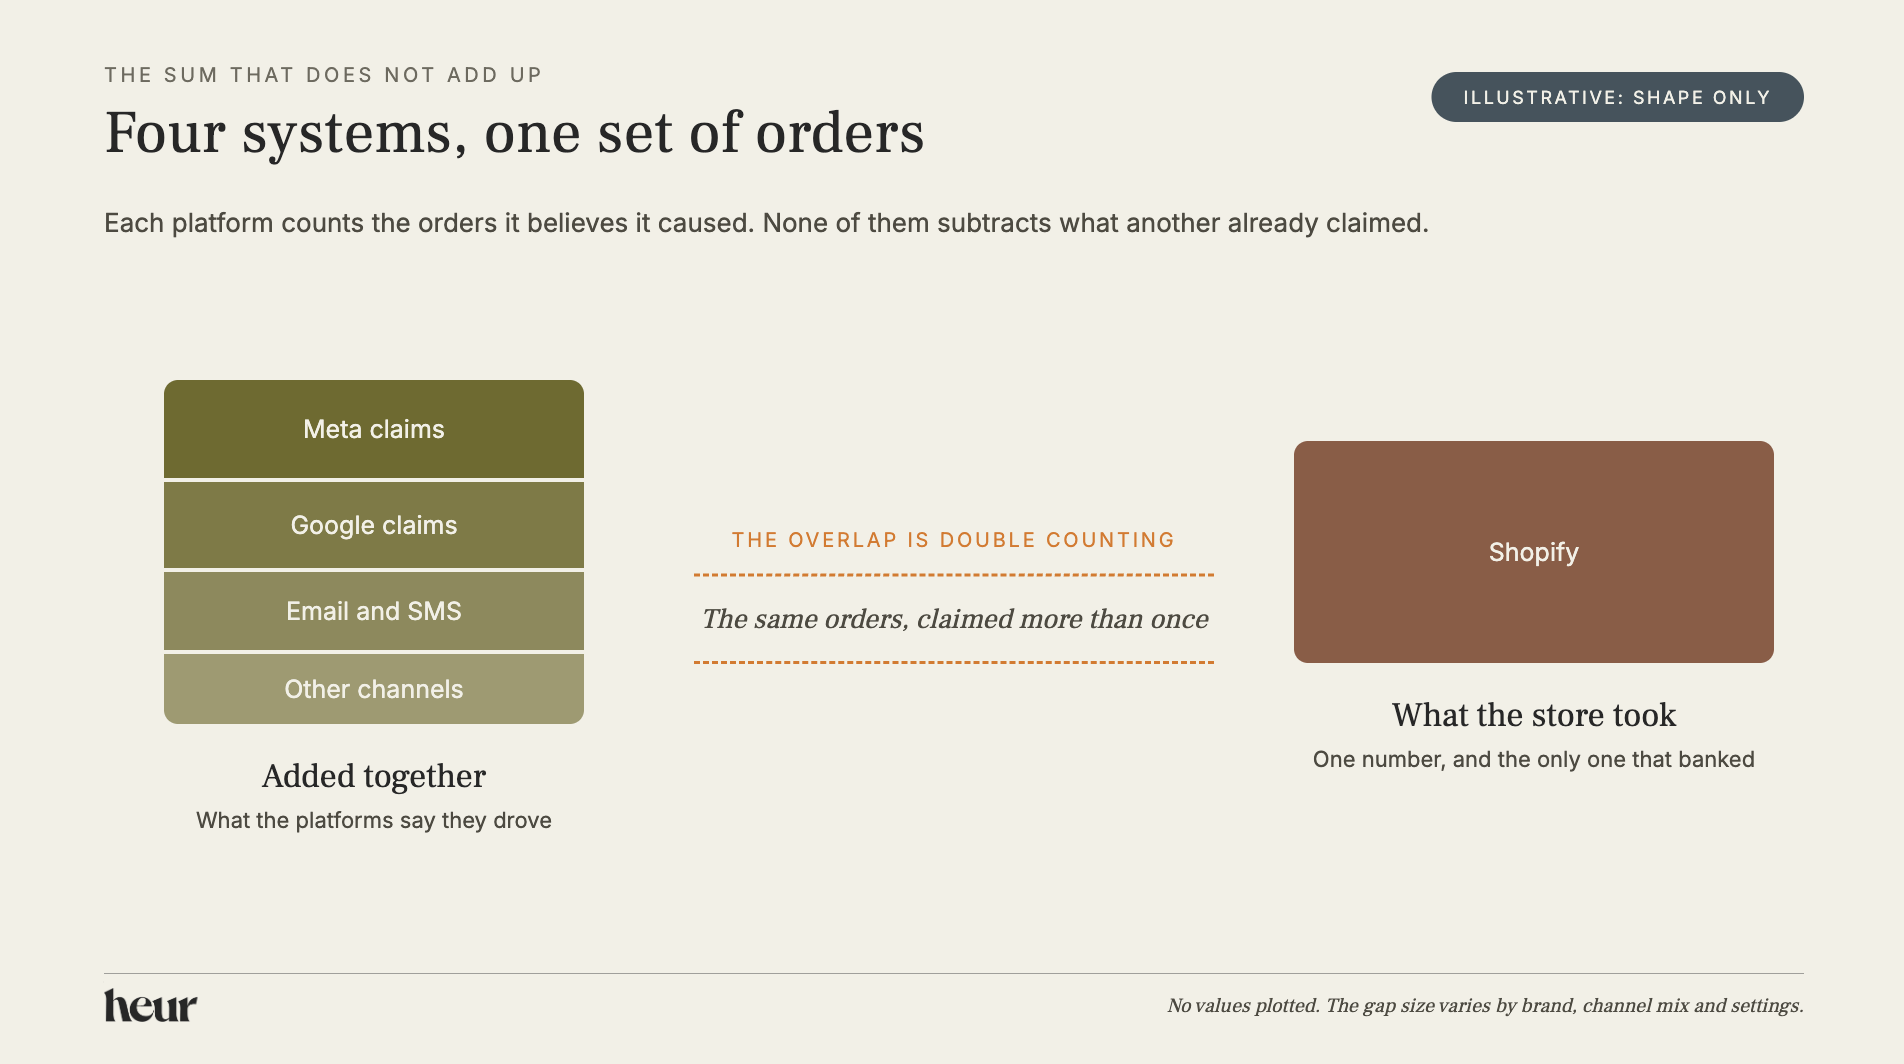
Nothing is broken. Four systems, each built to answer a different question in its own favour, described the same orders, and their answers add up to more than you made. Below: why that happens, how to separate a designed gap from a genuine fault in one afternoon, and which of the numbers you already have should decide what.
Why hunting for the mistake never works
You cannot make your platform numbers match Shopify, and most teams spend a week a quarter trying anyway.
The hunt does turn things up. You might find a tracking tag firing twice on the order confirmation page, counting every sale as two. You might discover that tax and delivery sit inside the figure sent to one platform and outside the figure sent to another. You might spot a timezone set differently in your shop and your ad account, pushing a day of orders across a reporting boundary. Fix all of it.
Then run the comparison again, and the numbers still disagree.
Here is why. When you hunt for a mistake, you assume one correct figure exists and the others are damaged copies of it. One correct figure does exist for how much money came in, and it lives in Shopify, because that is where the payments went through. No correct figure exists for who caused those sales, because that question has no single answer. Every platform reporting on it answers a slightly different version of the question using rules it wrote itself, and none of them are wrong on their own terms.
You have two gaps, and they point opposite ways
Work out which gap you have before you diagnose anything, because you have two of them and they run in opposite directions.
Your ad platforms report more revenue than Shopify, and that is over-claiming: several platforms counting the same order, each under its own rules, with nobody subtracting anybody else. This is the subject of most of this post.
Your website analytics reports less revenue than Shopify, and that is data loss. Shoppers who declined cookies, ad blockers, privacy browsers, sessions that closed before the confirmation page finished loading: Shopify still records the sale because the payment went through on its own servers, while the analytics event never fired at all.
Most brands run both at once, which is why the numbers feel impossible to line up. One set of figures inflates, the other deflates, and the truth sits in Shopify in between.
Over-claiming costs you money, because it flatters the decisions you make about spend. Data loss mostly costs you confidence, so treat the two of them with very different levels of urgency.
Every platform is answering a different question
Every advertising platform and marketing tool runs its own attribution. Attribution is simply the process of deciding which touchpoint gets credit for a sale.
They each need to. Meta has to know which of its ads worked so its system can serve more of that kind. Your email platform has to know which message preceded a purchase so it can weight the next send. None of them improves without that feedback, so treat it as an engineering requirement rather than an attempt to mislead you.
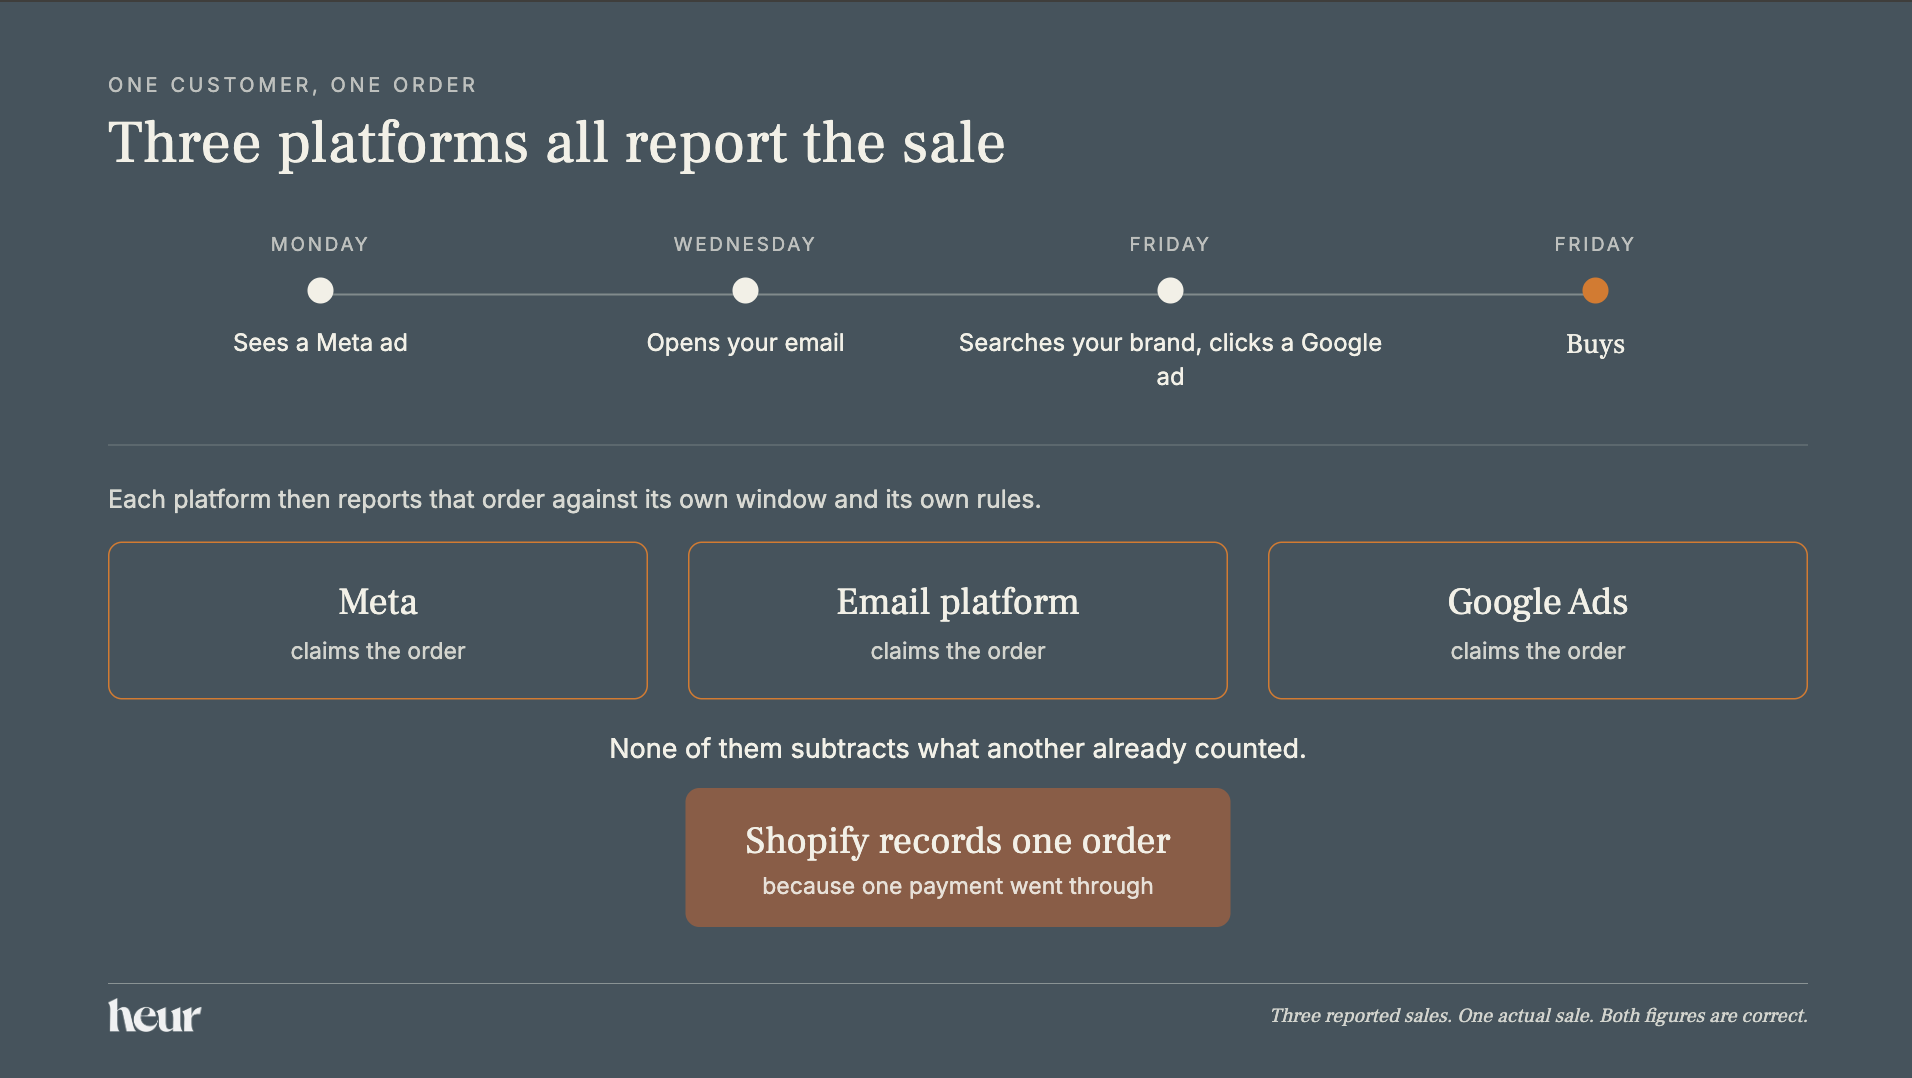
Each platform therefore tilts its reporting toward itself, and the incentive runs in one direction: a platform that counts generously looks like it is working. Each one sets its own rules about how far back to look, what counts as an interaction, and which touch wins when several are in play. None of them checks with the others, and none subtracts what a rival already counted.
So a customer sees a Meta ad on Monday, opens your email on Wednesday, searches your brand on Friday and buys. Three platforms report that sale. Each is correct under its own rules, and added together they describe a customer who bought three times.
How long each platform keeps claiming credit
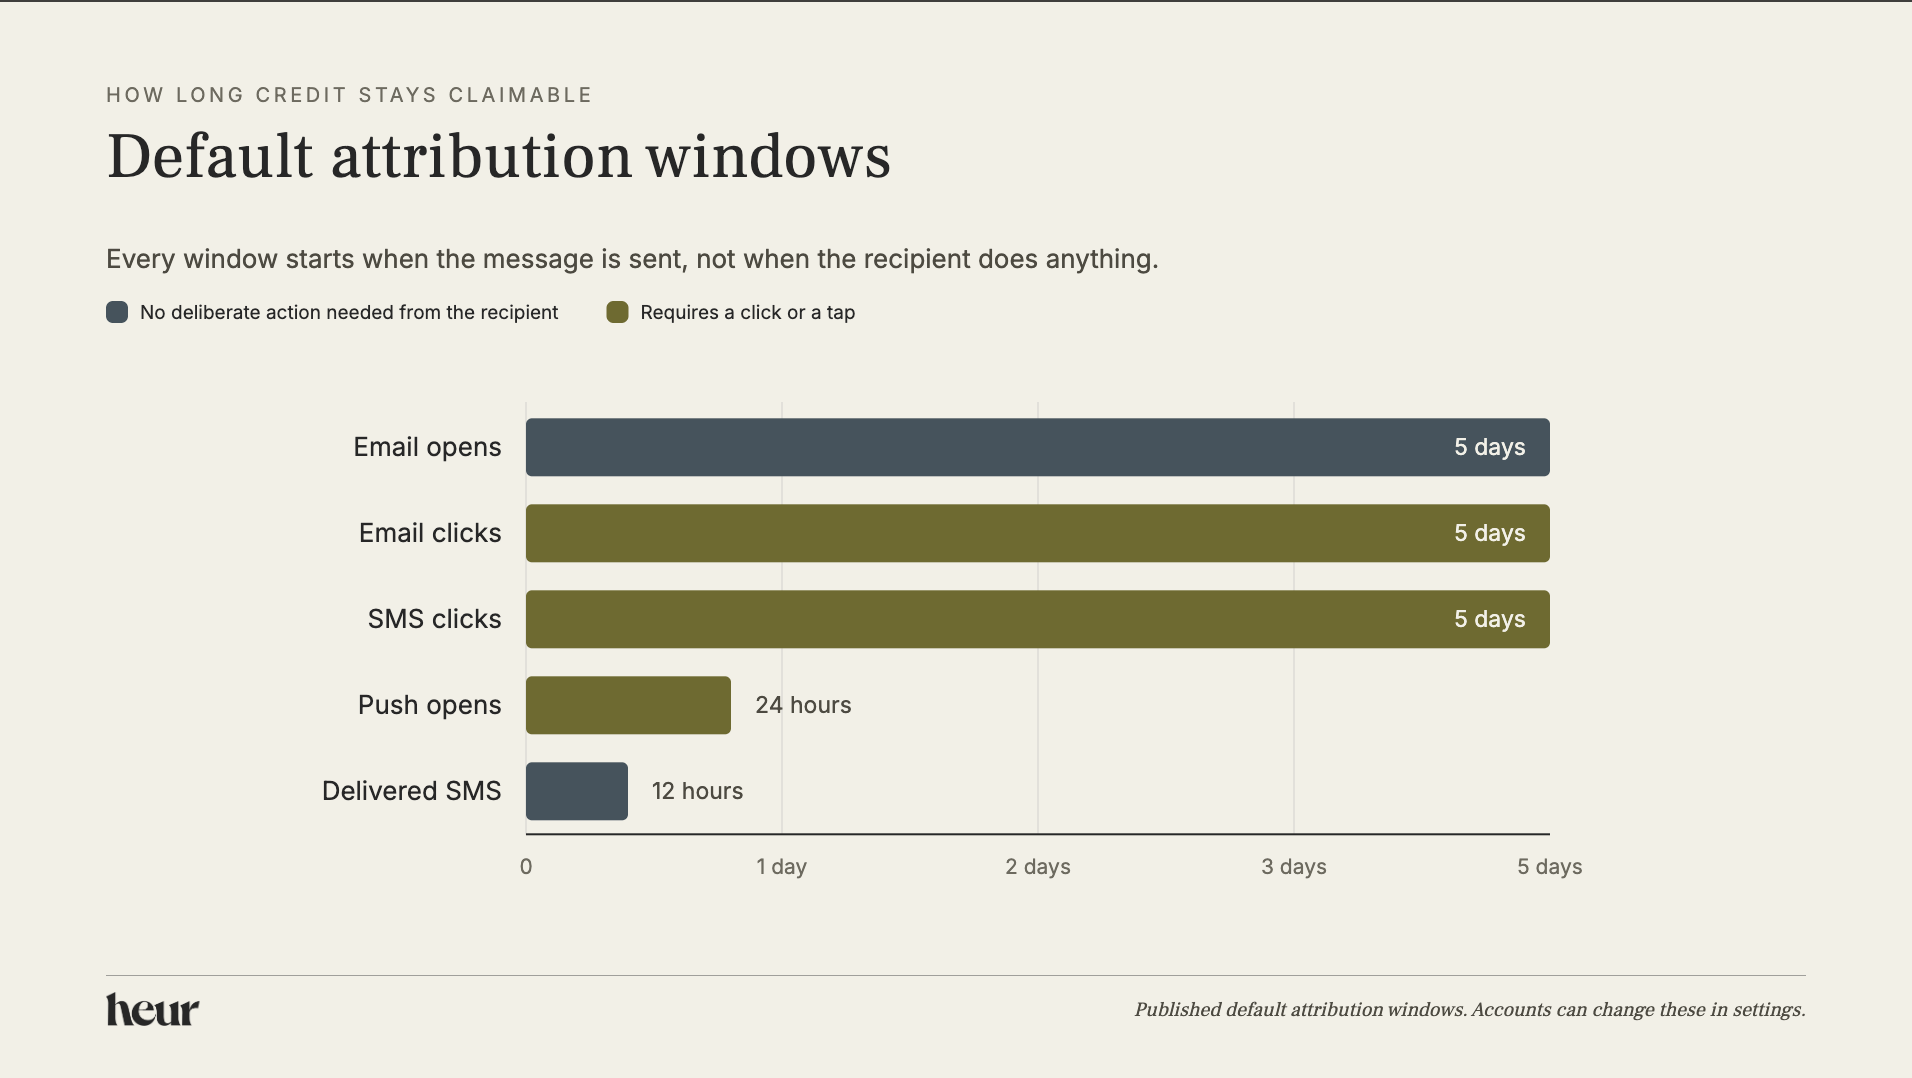
Most teams badly underestimate how long these windows stay open, and that is where the bulk of the excess comes from.
Klaviyo publishes its defaults, which makes it a useful worked example. Its documentation lists five days for email opens, five days for email clicks, five days for SMS clicks, 24 hours for push notification opens, and 12 hours for a delivered SMS. Read that last one twice. A text that landed on someone's phone, never opened and never clicked, opens a 12-hour window in which a purchase can be credited to it.
Go and check two settings on your own account this week. Filtering out bot clicks, the automated clicks generated by security scanners instead of customers, is switched on by default only for accounts created on or after 27 August 2024. Older accounts have been counting them unless somebody went in and changed it. You can also exclude Apple Privacy Protection opens, the automatic opens triggered by Apple Mail rather than by a person, though that exclusion currently does not show up in reporting.
Klaviyo also runs last-touch attribution by default, so the final message inside the window takes the whole order and the earlier ones get nothing.
Google Ads behaves differently, which is why its number usually sits closest to Shopify. Data-driven attribution is the default for most conversion actions, and it spreads credit across the interactions on the path instead of handing all of it to one. The older rule-based options have been retired. Splitting credit into fractions inside one ecosystem produces a smaller total than awarding full credit at every touch. Call that arithmetic rather than honesty. Google divides where the others duplicate, and that is the whole of the difference.
One caveat before you trust that. You set your own conversion window in Google Ads, and the default is 30 days, adjustable anywhere up to 90. Somebody chose the number sitting on your account, and it may not have been you. A 90-day window on a business with a two-week buying cycle hands Google credit for sales it had very little to do with. Go and check yours before you treat Google's figure as the reliable one.
The other big source of inflation is view-through credit, where a platform counts a sale because somebody scrolled past an ad without ever clicking. A system counting those will always report more than one counting only completed orders.
Two words worth knowing: attribution and incrementality
These two terms do a lot of work, and most measurement arguments happen because people use one when they mean the other.
Which number to use for which decision
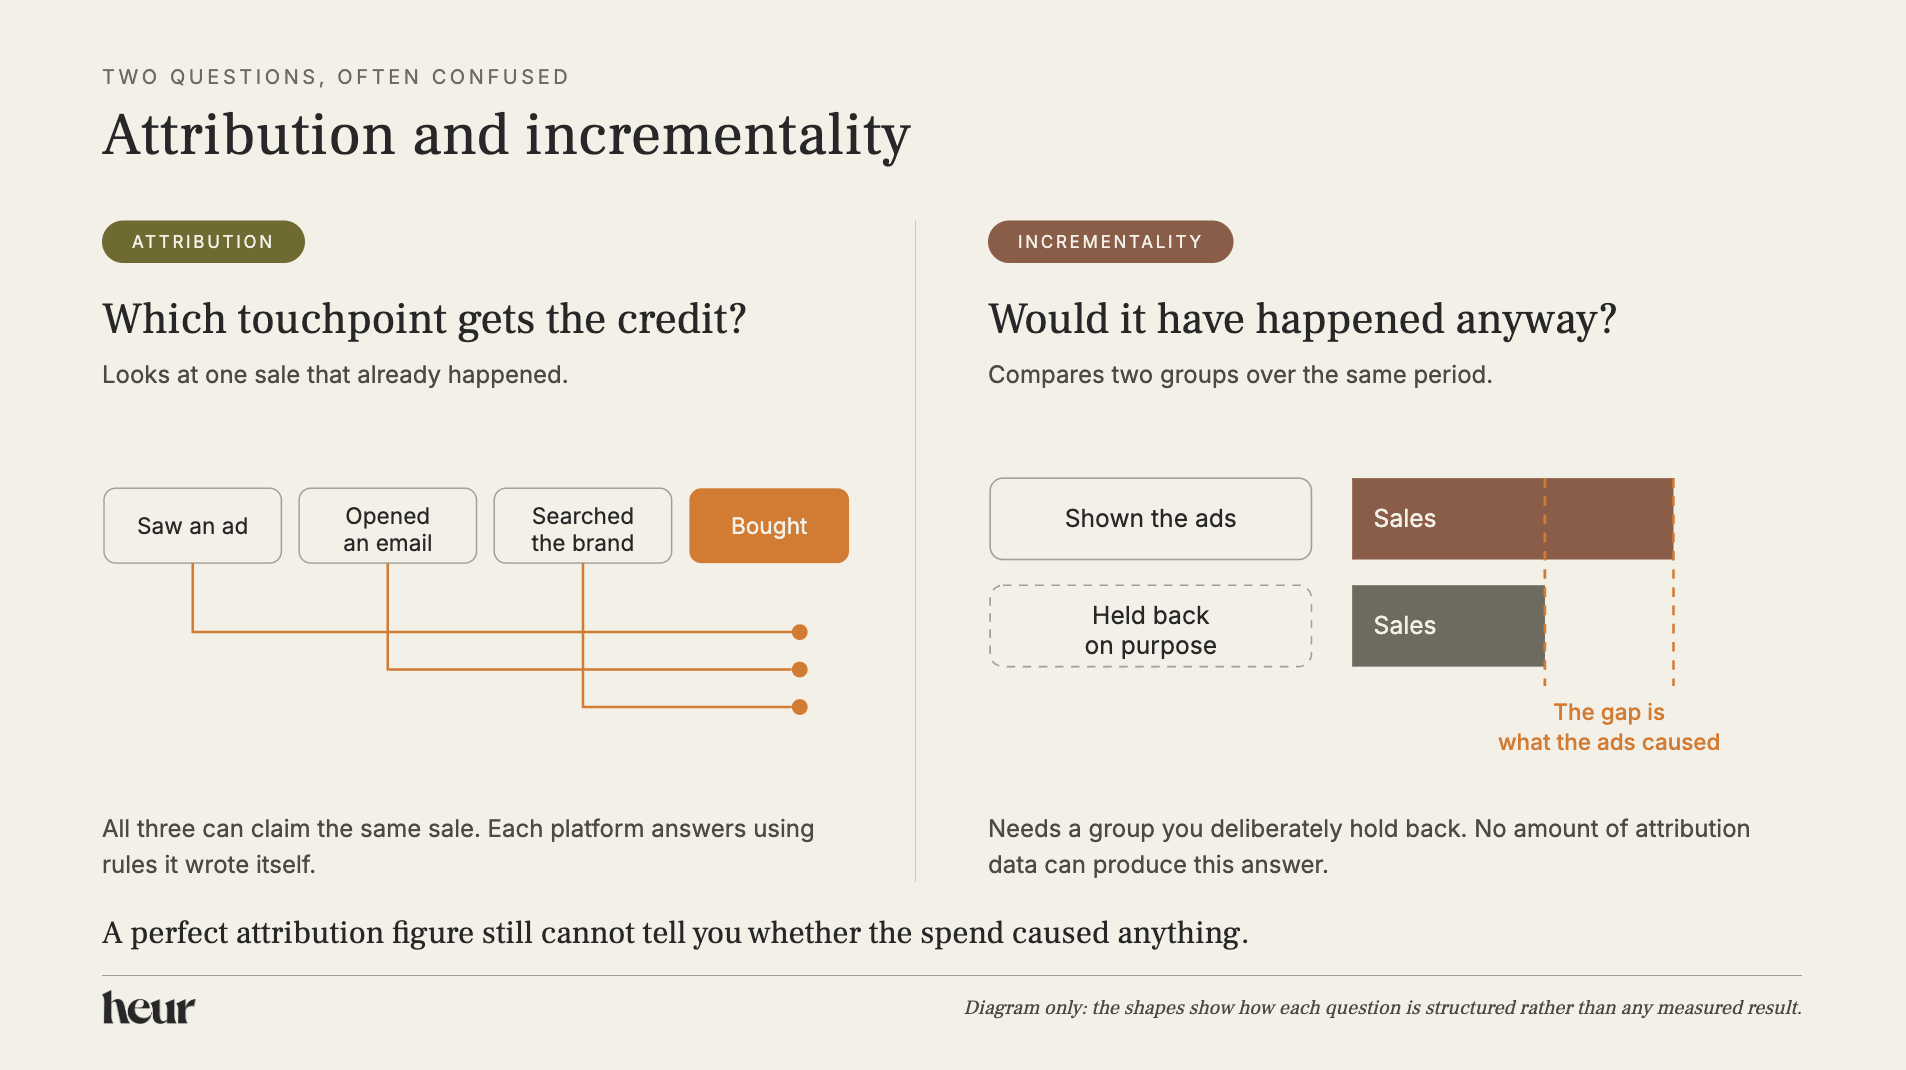
Attribution assigns credit for a sale that already happened. Incrementality asks whether the sale would have happened anyway, which needs a comparison: a holdout group, meaning customers you deliberately keep the ads away from, or a region where you switch the ads off.
Attribution can never answer the incrementality question, however advanced the model behind it. Picture a retargeting campaign, one that shows ads to people who have already visited your site, aimed at shoppers with items sitting in their basket. Those people were mostly going to buy. The campaign will report a superb ROAS and may be causing almost none of that revenue. The number is correct by its own rules and worthless as proof the spend did anything.
Once you can hear the difference, most measurement disputes become easy to diagnose. Someone offers an attribution number as evidence a channel works. Someone else says those customers would have bought regardless. Neither can settle it, because the figures on the table cannot address the question being argued about.
Check these nine things once, then stop
Everything above explains why the gap exists. Now rule out something being broken on top of it, because sometimes there is. Run this once, fix what it finds, then treat whatever remains as your normal.
- Compare day by day instead of month against month. A similar percentage gap on every day points to structure. One day standing well apart from the others points to a fault on that day, and gives you somewhere to start.
- Compare the order lists themselves. Export the orders from Shopify and the transactions from your analytics for the same dates, then check which orders appear in one and go missing from the other. Those are your tracking failures. Comparing totals will not show them, because two wrong numbers can still land close together.
- Check each pixel fires at all. Place a small test order and follow it into every platform. A tag that never fires is much harder to spot than one that fires twice, because nothing looks wrong. The platform simply reports a lower number and you conclude the channel underperformed.
- Check what value each platform receives. Confirm whether tax and delivery sit inside or outside the revenue figure passed to each one. A gap that holds identical in pounds every month usually traces back here.
- Confirm the timezone matches between your shop and every ad account.
- Look for tags firing twice. A conversion tag plus an imported analytics goal on the same confirmation page will count every order two times.
- Check what your cookie banner does. When someone declines analytics cookies, the order completes and the analytics event does not fire. That is the law working correctly, it is permanent, and no fix removes it.
- Check your bot-click filtering and your Apple Privacy Protection handling in Klaviyo, particularly on accounts older than the August 2024 change. Apple Mail opens messages on the recipient's behalf, so an open is not evidence a person read anything.
- Look for orders that never touched your website. Subscription tools, wholesale portals and marketplace integrations push orders into Shopify with no browsing session at all.
Write down the gap you are left with and the date. That figure becomes your baseline, and how steady it holds matters far more than how big it is. A baseline sitting at roughly the same level week after week tells you the system works. One that moves sharply in a single week gives you a fault worth chasing.
Which number to use for which decision
With the diagnostic clean, you can stop treating the numbers as rival versions of the truth and start using each one for a separate job. Most teams have never sat down and decided which tool does which job, which is why the same argument restarts every Monday. Here is how I would allocate them.
MER stands for marketing efficiency ratio: total revenue divided by total marketing spend, across everything, ignoring attribution entirely. New-customer MER runs the same sum using only revenue from first-time buyers.
Let platform ROAS decide creative, and nothing else. These numbers exist to help you optimise, and they were never built to account for anything. Inside one platform, comparing advert against advert, the inflation applies fairly evenly to both sides and largely cancels out. It gives you a direction of travel. Give every reading outside that narrow job some surrounding context.
Retargeting ads get credited with far more view-through than prospecting ads, the ones shown to people who have never heard of you, because a retargeted audience has already seen something. So platform ROAS holds up when you compare advert A against advert B in the same campaign, and misleads badly when you compare your prospecting budget against your retargeting budget.
Watch new-customer MER. Because it ignores repeat purchases, it moves when acquisition starts struggling rather than a quarter later. Keep blended MER beside it as a sanity check, because blended looks healthier when returning customers are strong and can hide an acquisition problem for months.
Never let one number make a budget decision by itself. Watching a number and acting on a number are two different jobs. New-customer MER tells you to go and look. What you find when you look is what justifies moving money.
Test creative constantly and test incrementality rarely. Creative testing hands you something to act on within days. Incrementality testing tells you whether a channel contributes anything at all, costs far more to run, and belongs on a much longer cycle. Sequence, not substitute. A quick creative read tells you nothing about whether the ads caused the sales, and treating it as though it does is how a brand talks itself into a retargeting budget it cannot defend.
Lead with net revenue when your founder asks what marketing did last month. Then build outward: spend, return, new-customer MER. Revenue is the win, and opening anywhere else turns the meeting into a debate about measurement instead of a conversation about the business. If they would rather lead on traffic or signups, give them that number and build outward the same way.
Common questions
What is a normal gap between Shopify and analytics?
No published figure is worth trusting here. Sources quoting confident benchmarks disagree across a very wide range and almost none of them explain how they measured. Work out your own baseline using the diagnostic above and watch whether it holds steady. A stable percentage, whatever that percentage happens to be, tells you far more about the health of your setup than any industry average ever will.
Why do my channels add up to more than my revenue?
Each platform applies its own attribution window independently, and none of them subtracts what another has already claimed. A single order touched by three channels gets counted three times, once by each of them. The system is designed to work this way, because every platform needs its own record of what worked in order to keep improving what it shows people.
Why does my analytics show less than Shopify when my ad platforms show more?
The two comparisons fail for unrelated reasons. Advertising platforms count generously, so several of them bill themselves for the same order. Your analytics depends on a script running inside the shopper's browser, which frequently does not happen. Shopify records the payment itself, which is why it sits between the two figures and matches your bank.
Is my email platform's revenue figure accurate?
It is accurate under that platform's own rules, and those rules run wider than most people assume. Klaviyo's published defaults reach five days for email opens and clicks, and a delivered SMS opens a 12-hour window with no click required. Check your bot-click settings as well, since they stay switched off on older accounts unless somebody has been in and changed them.
Should I use a third-party measurement tool?
It will not resolve the disagreement, because there is no correct answer for it to find. What these tools do well is pick one attribution model and apply it consistently across every channel, which helps enormously if your problem is that nobody agrees on a definition. What you are buying is consistency, which is worth having. Just do not mistake it for truth.
What is the difference between attribution and incrementality?
Attribution assigns credit for a sale that already happened, using rules each platform writes for itself. Incrementality asks whether the sale would have happened anyway, which needs a holdout group or a regional test. Attribution figures cannot demonstrate cause, however sophisticated the model.
What to do next
- Run the diagnostic once, fix what it finds, and write down the remaining gap along with the date.
- Decide your rules and write them down where the team can see them: which number governs creative, which one you watch weekly, what evidence a budget change requires.
- Lead your leadership reporting with net revenue, then spend, then new-customer MER.
- Put creative testing on a constant cycle and incrementality testing on an annual or per-channel one.
- Watch whether the gap holds steady rather than worrying about its size.
- Re-run the diagnostic whenever your setup changes, such as a new checkout or a new sales channel.
Every recommendation costs something, and pretending otherwise would make for a poor start.
Some shops do have broken tracking, and the ones who found it found it by going looking. Run the nine checks properly the first time and you earn the right to stop looking, which is the entire point of doing them. Skip them and you risk sitting on a fault for six months.
Choosing MER as the number you report and defend gains you a figure that holds steady, while giving up the ability to allocate between channels from it alone. Take that deal. You are swapping numbers that look precise and point somewhere unhelpful for one that is reliable and incomplete, then closing the remaining distance with judgement about your own business, which is the part nobody can automate for you.
The measurement industry will keep offering to close that distance with software. It cannot. Four companies are answering four different questions about the same orders, and any tool that merges them has quietly picked one of those answers and invited you to believe it. Knowing that puts you ahead of most of your competitors, who are still looking for the bug.
So the way through is smaller and more within your control than the software pitch suggests. One afternoon on the diagnostic. One page of rules where the team can see them. After that the weekly argument stops, and the time goes back into the offer and the creative work that moves the numbers, which is where it was always worth more.
The afternoon is the easy part. Holding the rules in place while three platforms keep offering your team a better number is the part that needs someone whose job it is. If that is the bit you would rather hand over, say so.